Using Maps and Data to Make Your Case
Many healthy food access policy efforts and funding opportunities require data-supported descriptions of a community’s needs as part of the application process. For example, federal Healthy Food Financing Initiative applications often request data related to (i) the lack of access to healthy food retail outlets in your community; (ii) patterns of non-healthy food consumption, such as low rates of fruit and vegetable consumption; (iii) poor health indicators including rates of obesity, diabetes, and other diet-related chronic diseases; and/or (iv) participation in food assistance programs such as the Supplemental Nutrition Assistance Program (SNAP) and Special Supplemental Nutrition Program for Women, Infants, and Children (WIC).
This tool provides much of the data requested and can be used to strengthen your funding application. Please note that the food access landscape is ever changing, and you may need to corroborate data indicators with local knowledge. We also encourage you to explore other resources in this portal to learn more about determining whether a community is underserved by healthy food retail and to make the case for healthy food retail investment.
The following is an example of a narrative and maps using the data and information generated by the “Get Report” function for Cuyahoga County, the City of Cleveland and zip code 44106.
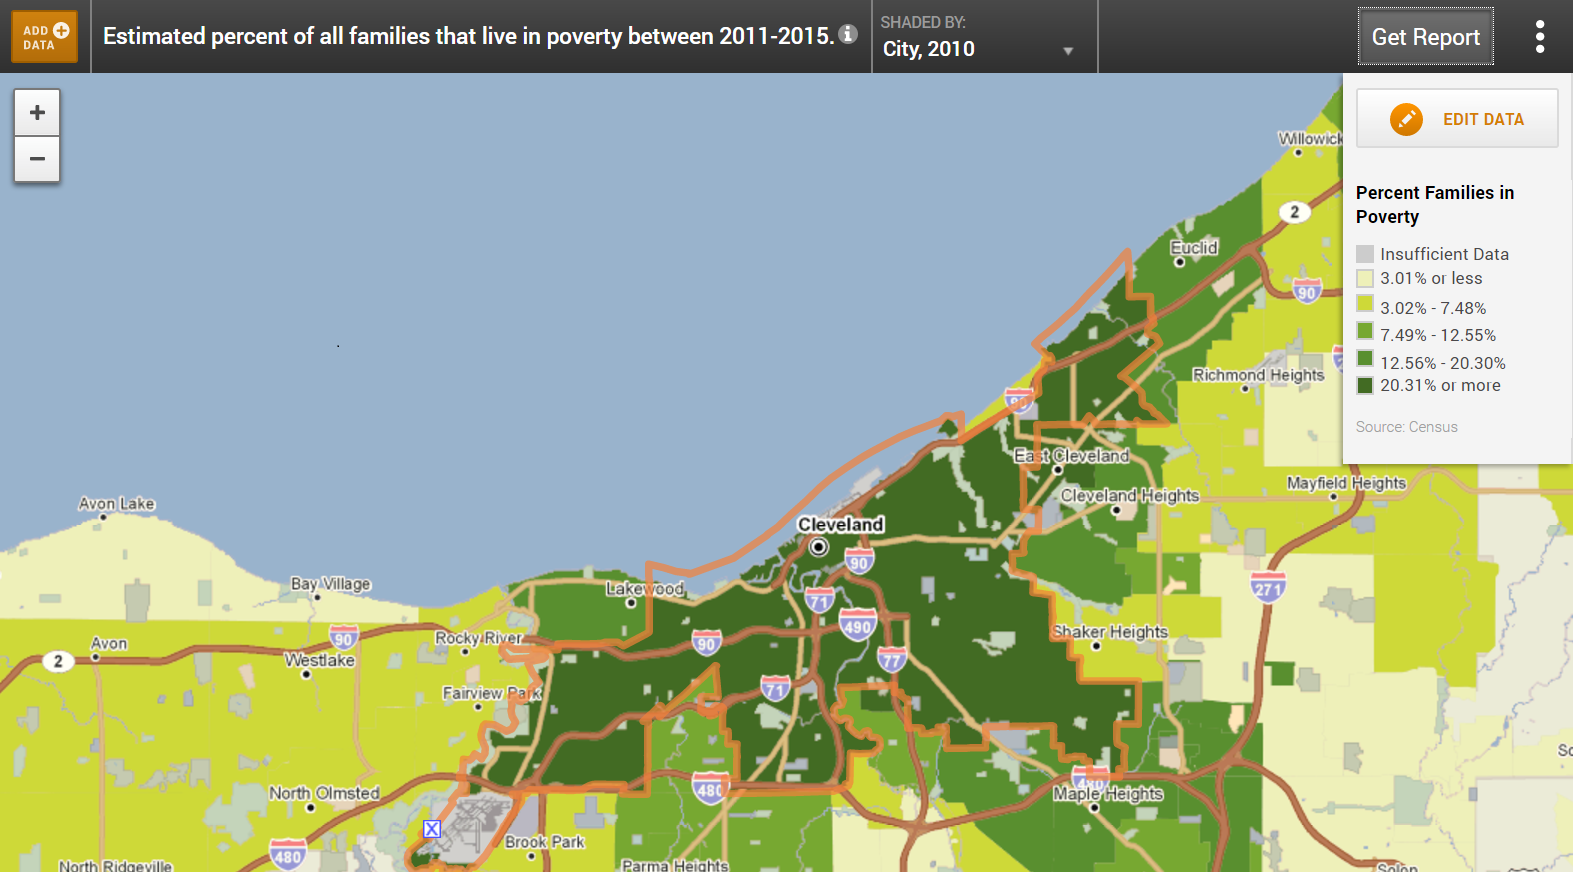
Almost one-third of the Cuyahoga County’s residents live in the City of Cleveland (delineated with orange border), the County’s largest city. Accessing healthy food is a challenge for some Americans - particularly those living in low-income neighborhoods and communities of color. Research has shown that, if a person is Black, Hispanic or living in a low-income block group they are more likely to live in an area with limited access to a full-service supermarket. Per 2015 American Community Survey (ACS) data, persons of color represent 76.3% of Cleveland’s population. In terms of age, 23.16% were children under age 18, while 12.67% were over age 65. The median household income for Cleveland is $26,150 and one fifth of Cleveland’s families live in poverty.
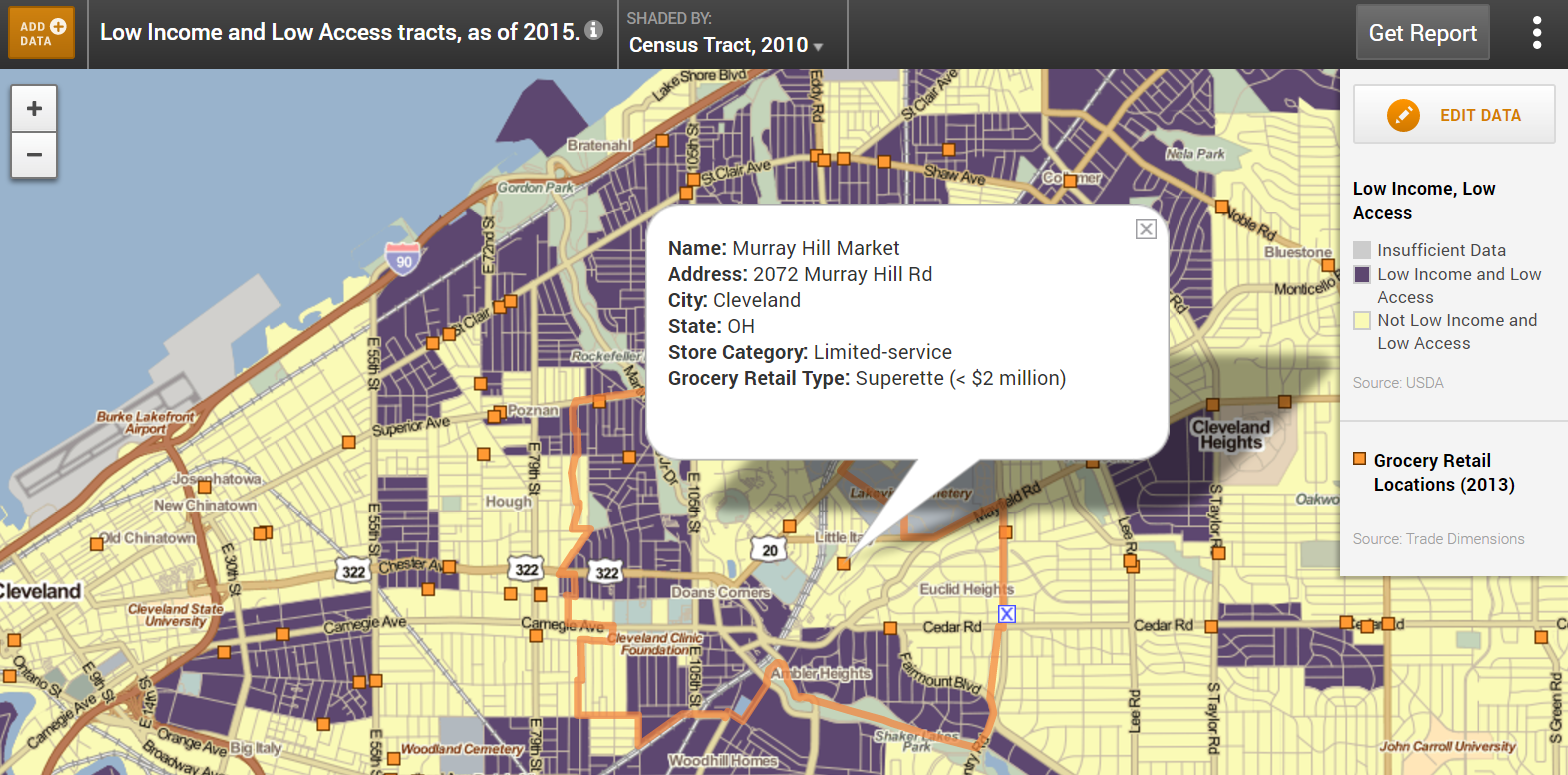
Many of Cleveland’s low income residents do not have reasonable access to healthy foods. Per the USDA, an estimated 105 of the City’s 177 census tracts are Low Income, Low Access areas. Based on Reinvestment Fund's 2014 Limited Supermarket Analysis (LSA), there are 5 LSA areas within Cleveland. The estimated leakage for these areas is $63,241,000; this represents the amount that residents spend at stores located outside of the LSA. In 2013, there were two (2) full service supermarkets located in Zip Code 44106 (delineated with orange border), four (4) Limited Service stores located, and 5 farmers markets within the study area. SNAP benefits are accepted at 23 participating stores, farmers markets, social service agencies or other non-retail providers in this community.
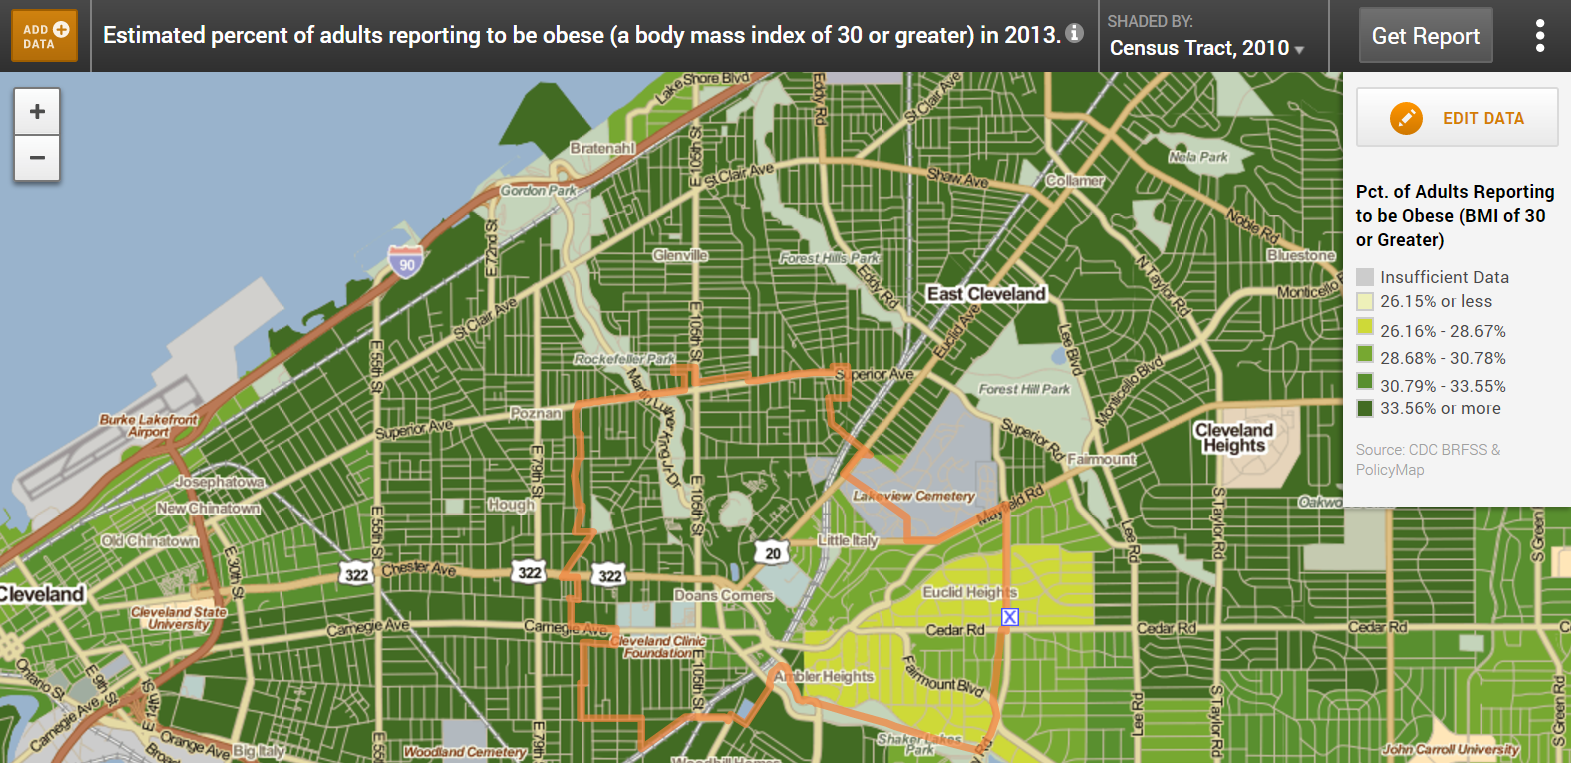
Within Cuyahoga County, 21.23% of people received SNAP benefits in 2011, amounting to $461,497,000 in benefits to program participants. An estimated 84% percent of county residents consume less than the recommended five servings of fruit or vegetables per day. As of 2013, 34.7% of the population residing in the Zip Code 44106 (delineated with orange border) are considered obese.


